 / laugh at PosterX / GroupOfPeopleY who thought / believed *insert though/belief here*"
 Tweet
Tweet
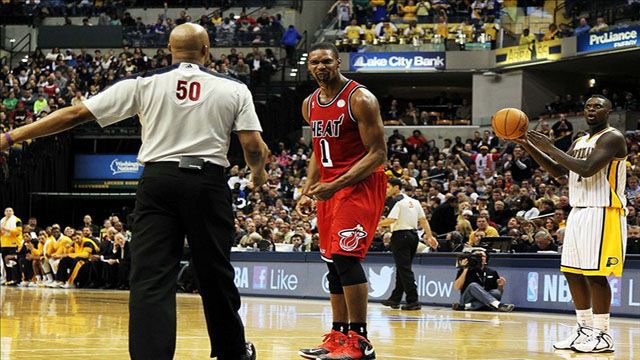
WITNESS THIS!
 -VS-
-VS-
Game Time Start: 6:00 PM ET
Where: AmericanAirlines Arena, Miami, FL
Officials: D. Crawford, M. Boland, D. Collins
Media Notes: Indiana Notes, Miami Notes
Television: FOX Sports Indiana / Sun Sports / NBA TV
Radio: WFNI 1070 AM / WAXY 790 AM
NBA Feeds:
*NBA Audio League Pass (available free to NBA All-Access members)
*NBA League Pass Broadband (subscription req'd)
*NBA League Pass Broadband (subscription req'd)
REMINDER: Per PD policy, please do not share a link to, describe how to search for, request a link to, or request a PM about streaming video of a NBA game that is not coming directly through the NBA. Not even in a "wink-wink, nudge-nudge, know-what-I-mean" round-about sort of way. Thank you

|
|


 |
 |
 |
 |
 |
 |
 |
 |
 |
 |
 PACERS Danny Granger - sore knee (out) HEAT None |
 |
3-on-3 Preview: Pacers at Heat In another installment of the Heat Index's 3-on-3 series, our writers give their takes on the storylines before the Heat face the Pacers on Sunday (6 p.m. ET). 1. Fact or Fiction: The Pacers are the biggest threat to the Heat’s repeat bid. Tom Haberstroh: Fiction. In the East? Probably. But the Thunder, the Grizzlies, the Clippers and the Spurs would probably give the Heat more trouble than the Pacers. The Pacers defense might be the stingiest of the group, but I'm skeptical of the offensive firepower. Michael Wallace: Fiction. The Pacers are the second-biggest threat -- and only if they get reliable perimeter shooting. I believe a healthy Spurs team is the Heat's biggest potential threat. They have an efficient, attacking point guard, a big man who's effective on both ends and floor spacers who knock down threes. And I didn't even mention Gregg Popovich. Brian Windhorst: Fiction. I think the Pacers play the Heat with more edge than any other team in the East. Yes, even more than the Celtics. There's genuine animosity there and it manifests itself in the games. That said, I just don't believe the Pacers are a bigger threat than the Spurs, Thunder or perhaps even the Clippers. 3. Fact or Fiction: The Heat’s streak will still be intact after Sunday. Haberstroh: Fact. This is the last obstacle that LeBron James has to conquer this regular season, and I'm learning not to doubt him at this point. He's shooting over 60 percent on this 17-gamer, which is outright baffling for a perimeter player. Wallace: Fact. The regular-season series will end with the Pacers holding a 2-1 edge and both teams having held serve at home. What does that mean in the bigger picture going into the playoffs? Absolutely nothing. Regardless of Sunday's outcome, Indiana is confident it can beat the Heat. Miami is confident the Pacers haven't quite...CONTINUE READING AT HEAT INDEX |
 |
Ian Levy: Team Defense - Product and Process On his college basketball blog, Ken Pomeroy has been arguing, for quite some time, that a more descriptive measure of a team’s three-point defense is opponent attempts as opposed to opponent 3PT%. While his commentary has focused on three-point shooting the same point holds true, to a certain degree, with shots inside the arc. As first it may seem counter-intuitive for the most accurate description of how well a team defends certain areas of the the floor not to be field goal percentage. But if we talk the idea through it quickly seems less radical. Although it may not feel like it at times, NBA players take good shots. In the vast majority of cases, if a shot has little or no chance to go in, an NBA player won’t take it unless the game situation somehow dictates that this is the best option. There are of course, stunningly obvious counter-examples – see Smith, J.R. – but when we applaud teams that take good shots, or chastise a player for poor ones, we are splitting hairs and ignoring the countless impossible and improbable shots that they passed up. In that context we can comfortably say that often, the best defended shots are the ones where the defense allowed such low-percentage openings that the offense recognized it wasn’t in their best interest to take them. This idea represents a big and often overlooked measure of quality defense. We look at shooting percentages to evaluate defense, but that often offers precious little distinction. Looking at 386 team seasons, going back to 2000-2001, we find the average 3PT% to be 35.5%. The average for the top 38 teams from that time span was 38.3%. The average for the bottom 38 teams was 32.6%. That means the top and bottom 10% of teams were separated by just 5.7 percentage points. The other 310 teams from the last 13 seasons were separated by less than 5.7 percentage points in 3PT%. Another way we can demonstrate this is with variance, a statistical measure of how spread out the values are in a given data set. Over the past thirteen years the variance in team 3PT% has been 0.0003. The variance in the percentage of a team’s field goal attempts that are three-pointers is 0.0008, nearly four times the variation. There is a lot of difference in the frequency with which teams shot three-pointers, but not nearly as much difference in their accuracy. This is a huge lesson for both offenses and defenses. Even if you are an average shooting team, you can make a huge difference for your offense just by taking good shots. The same thing is true defensively – you may only be able to depress an opponent’s shooting percentages so much, but you can force them to take difficult and inefficient shots. You may not be able to keep a team from shooting 40.0% on mid-range jumpers, but if you’ve kept your opponent away from the rim and left those mid-range jumpers as the only option, chances are you’ve done your job. Last week I shared some statistical analysis I did with my shot-selection metric, Expected Points Per Shot (XPPS), estimating that about 19.4% of the variation in Offensive Rating can be explained by shot-selection. Using a variation on the technique from that post, borrowed from Evan Zamir, we can illustrate exactly how much of a difference controlling an opponent’s shot selection makes. We know from that analysis that TO%, ORB%, XPPS and Shot-Making Difference explain 97% of Offensive Rating, and in the inverse, Defensive Rating. From that regression analysis we also know that those factors explain efficiency with this equation: ORTG or DRTG = (XPPS * 88.55655) + (Shot-Making Difference * 84.41452) + (ORB% * 48.4174) + (TO% * -128.14) + 15.22669. The first thing we do is create an imaginary team that is completely average with respect to each of those variables above – ORB%, TO%, XPPS and Shot-Making Difference. This completely average imaginary team would have a DRTG of 102.83. From here we can, one at a time, manipulate each variable, measuring the change in DRTG. What I did was begin by looking at FG% from each area of the floor. One at a time, I reduced the FG% from each area by one standard deviation, leaving the others at league average, measuring the change on Shot-Making Difference and the resulting Defensive Rating. I then did the same thing for the percentage of shot attempts from each area of the floor, measuring the change in XPPS and the resulting Defensive Rating. When I reduced the percentage of shot attempts from an area, I needed to replace those shot attempts in another area of the floor to make sure I still had 100% represented. By that I mean if I reduced the percentage of attempts that came at the rim, I had to redistribute that percentage of attempts to the other areas of the floor. I did this, not equally, but by using the relative percentages of the remaining areas. Here were the results:  In the analysis that follows I’m going to repeatedly refer to controlling attempts and controlling accuracy. With each mention there is the implication that the last 13 years of NBA data provides an accurate representation of minimums, maximums and averages. Obviously, if you could force an opponent to miss every single corner-three attempt, accuracy would be the most important factor. But we must assume that teams are largely bound by the historical patterns which set our baseline expectations. A move of one standard deviation in each area is roughly equivalent to going from league average to the top or bottom five in each category. From the results we see that the biggest difference a team defense can make is trips to the free throw line as a percentage of their opponents’ scoring opportunities. The second biggest impact is to reduce your opponents’ shooting percentages on shots at the rim. The third biggest impact has to do with the percentage of opponent’s shot attempts that come from the mid-range, and requires a little explanation. To keep my method consistent...CONTINUE READING AT HICKORY HIGH |
Pacers Mike Wells @MikeWellsNBA Jared Wade @8pts9secs Tim Donahue @TimDonahue8p9s Tom Lewis @indycornrows |
Heat Brian Windhorst @windhorstESPN Tom Haberstroh @tomhaberstroh Ira Winderman @iraheatbeat Joseph Goodman @miamiheraldheat |


Comment